With the gradual yet steady rise in successful Internet of Things (IoT) deployments, many paradigms associated with digital transformation that seek to drive concrete business outcomes are emerging in the industry. Among these, an idea gaining rapid popularity is the notion of a “digital twin”; in fact, Gartner has included digital twins in its Top 10 Strategic Technology Trends for 2017, 2018, and 20191. As with popular and, therefore, glorified technologies, the phrase “digital twin” is being overused to the point that its underlying meaning has been diluted. An inevitable consequence of this overuse is that numerous notions of digital twins have emerged that tend to obscure rather than clarify the underlying meaning.
As with Artificial Intelligence (AI), Machine Learning (ML), or Deep Learning (DL)–or even IoT– the underpinnings of the technologies which come together to create a digital twin have been around for a long time. It is therefore enlightening and useful to look back in time and trace the origins of digital twins, and understand their various manifestations over the course of the past four decades. Based on this understanding, we propose a five-level taxonomy for asset-based digital twins. This representation not only helps in classifying digital twins but also helps the industrial community in evaluating where they stand in terms of their digital twin deployment.
What is a digital twin?
Due to the aforementioned confusion in the market, this nebulous term is defined and interpreted differently by multiple parties. For the purposes of this paper, we will simply define a digital twin as a virtual representation of a physical asset (or a system, or fleet, of assets). Virtual representations of a manufacturing process or warehouse operations are called process twins. Starting from such a fundamental definition allows us to explore the numerous facets and associated concepts that it can subsume. Needless to say, technologies such as AI, ML/DL, sensor, connectivity, simulation, and big data paradigms have led to very sophisticated digital twins. However, to appreciate the genesis of digital twins, it’s important to take a trip down memory lane. The emergence of IoT has brought about a distinct improvement in our ability to build comprehensive digital twins. Therefore, it is important to look at two timelines from the historical context: Pre-IoT era and IoT era.
The internet of things has ushered in an era where affordable sensors, ubiquitous connectivity, and industrial IoT platforms are all being employed to address concrete business needs. However, the fundamental underlying principle of a digital twin predates the era of IoT. The term “digital twin” itself is attributed to a presentation made by Dr. Michael Grieves in 2003 in an executive course on PLM2, though the concept of a digital twin long predates the inception of the term itself. Perhaps the most illustrative example is from NASA’s space exploration initiatives. For most space missions, NASA creates an exact replica of the space capsule in their labs on earth, a technology called “pairing,” which allowed NASA to rescue the Apollo 13 mission. If the real capsule in space encounters an issue, mission control would simulate the exact issue in their earth-based model to figure out how the issue can be corrected. Nowadays, with sophisticated sensors and communication technologies, real-time data is easily accessible even from outer space, but the digital twin idea is still crucial to NASA, and is still applied today, and will be in upcoming missions like Orion.
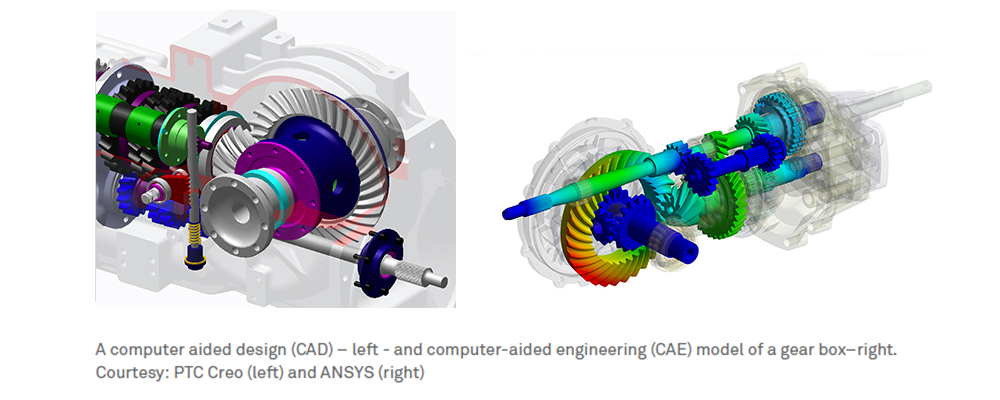
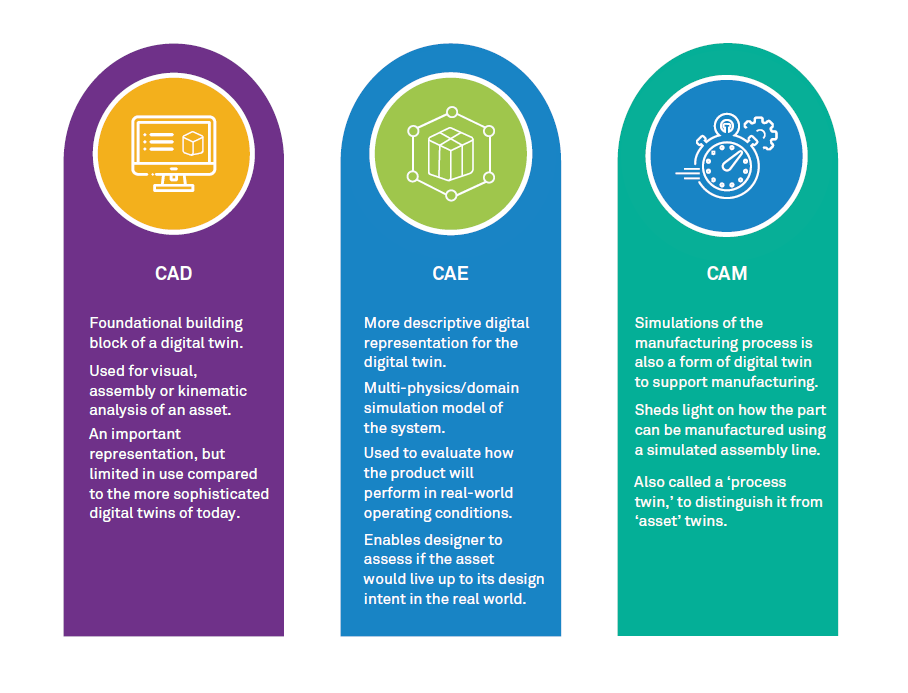
Traditionally, engineering design teams use computer-aided tools to design assets. A bicycle manufacturer might use Computer Aided Design (CAD), Computer Aided Engineering (CAE) and Computer Aided Manufacturing (CAM) across the entire product life cycle. These representations of assets are not new. Early applications of CAE date back to the late 1960s, most notably, by Dr. Swanson who developed the first version of ANSYS – a CAE tool – in 19703. Designs of complex machines such as gas turbines and jet engines, internal combustion engines, locomotives, automobiles, and so on rely upon CAx technologies to limit costly experimentation and testing, so designers can improve their confidence on how the part will behave in the field even before building a single part. Such computer-aided representations, in addition to insights gleaned from controlled experiments, allow us to evaluate how the asset will perform in the field, as well as optimize how it is manufactured – thereby serving as an important digital twin representation of the asset. These form the ‘as-designed’ and ‘as-built’ digital representations of the asset.
Limitations of pre-IoT era digital representations
While the as-designed view of the asset and associated insights are useful, there is seldom direct feedback that designers obtained about the assets in the field. Service engineers would document the failure or performance misses of the asset, and only in situations where there are recurring part issues, that information would be sent all the way back to the engineering design teams. Designers were also not aware about the product performance in the field – even if there were no failures. In other words, they seldom had an ‘as-used’ view of their design. Based on certain rules and design limitations laid out by the designer, the service engineer would evaluate the product, and, as long as any recordable readings of product performance were within limits, the product was deemed to perform as per design expectations.
The era of IoT
As internet connectivity spread, humans became more interconnected, and thereby had access to more information. Cloud-hosted consumer and enterprise-focused applications became popular. Around the same time, businesses began exploring the benefits of machines being connected to each other – and, subsequently, also to the internet. Machines talking to machines, so-called M2M communication, was again not new; such communication was quite popular in the manufacturing industry. Connecting machines to the internet was, however, new. By connecting machines to the internet, convergence of operational technology and information technology became a reality. Product (or asset) manufacturers introduced sensors and connectivity mechanisms into their newer “smart” machines. Manufacturers created sensor-enabled, internet-connected boxes that allowed operators to connect their “dumb” brown-field equipment to the internet. Data analytics, ML and AI services moved to the cloud, and sensor data, performance statistics, and associated insights could be displayed on cloud-hosted dashboards. With just cellular or WiFi connectivity, machines deployed in the field could now communicate to the internet. Asset operators could monitor equipment performance from anywhere. The current IoT era was born. This era also led to the so-called fourth industrial revolution, or Industry 4.0.
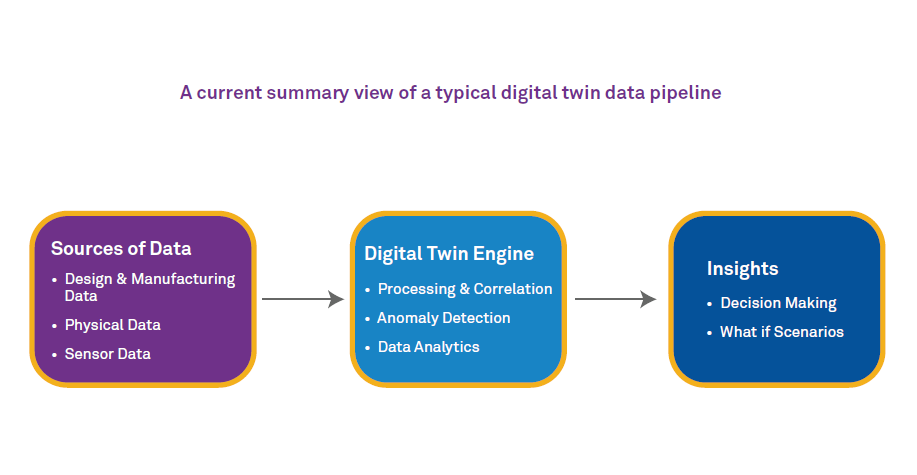
Before long, service engineers began asking how performance data could be exploited to provide better customer experiences and also optimize after-sales service agreements. If there was no real need to shut down and service a machine, you didn’t have to! This meant no more unplanned downtimes, which ultimately led to improved customer experience. Now, IoT provided manufacturers with avenues to boost bottom line profits. With so much data – more so, in near-real time – coming from the machines in the field, engineers could evaluate whether there were anomalies in the field data and recommend condition-based maintenance. All of this data was encapsulated in a digital twin of the asset. Design engineers began providing design insights on the asset to the service engineers, and companies augmented the digital representation of the asset with physics-based models, probabilistic techniques, machine learning, artificial intelligence, and immersive visualization. Both cloud-hosted and on-premise applications that provided insights to field engineers and designers alike gained in popularity. In the current IoT era, such digital twins found a unique role in any digital transformation journey.
Limitations of current IoT era digital representations
Digital twin representations in the current IoT era clearly are extremely useful, however, given the numerous flavors of digital twins, not all references to digital twins are consistent and uniform across the industry. Each variant has some unique limitations. Actionable insights associated with each of these digital twin representations are also very different.
For instance, a digital twin that contains only the CAD data model and field sensor data allows engineers to perform prognostics and visualize how the asset is performing in the field. However, these insights are not enhanced by insights obtained from design of the asset. Here, the link between ‘as-designed’ and ‘as-used’ states of the asset is not complete. Even with this representation, however, the engineer can determine anomalies in the sensor data and flag them appropriately so corrective action can be taken. In the absence of expert guidance or a thorough root cause analysis, this representation does not necessarily shed light on ‘why’ the anomaly occurred.
When this representation is augmented with design insights, engineers gain an understanding from the design phase as well as from field performance of the assets, and therefore the link between the ‘as-used’ and ‘as-designed’ view of the asset is maintained. Clearly, this representation provides the engineer with a better ability to identify the root cause of the anomalies by comparing performance with design considerations and taking corrective action. This insight can impact how the asset is designed.
The five-level digital twin taxonomy
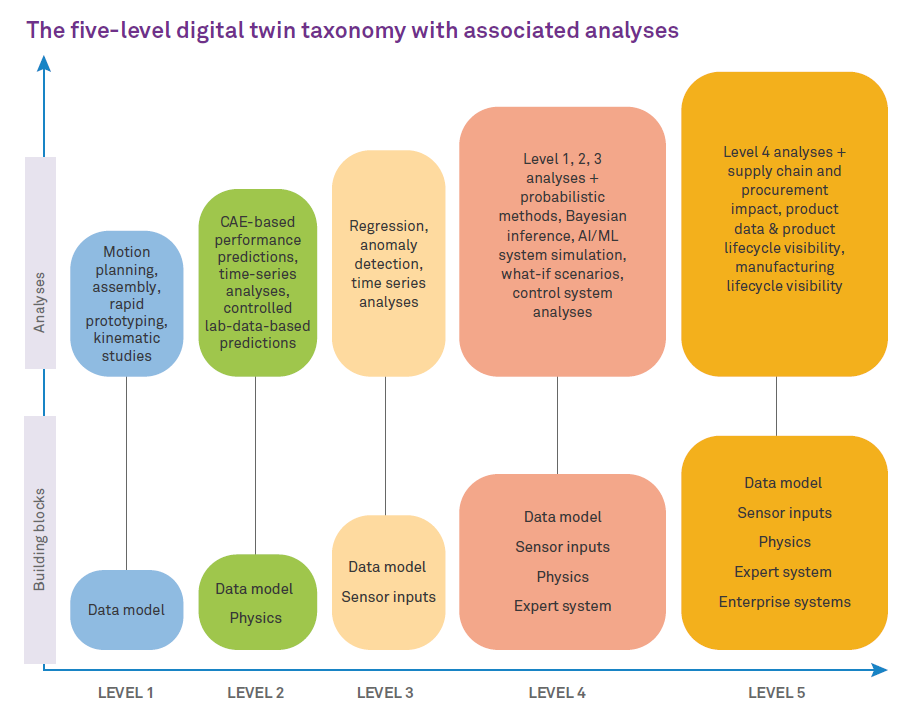
To account for various manifestations of digital twins, we propose a five-level taxonomy which is described below. Associated with each classification level are the kinds of analyses that we can perform using the accessible data from each digital twin representation, and consequently, the kind of insights that we can obtain from them.
For industrial products or assets, a fundamental representation of a digital twin is a data model of the asset, which can be as simple as the CAD model itself. We refer to this generic description of the asset as a ‘data model’ in the taxonomy. The Level 1 representation when augmented with physical simulation insights such as from CAE or controlled lab experiments leads to a Level 2 digital twin. A digital representation that couples the sensor data from the field with the data model is a Level 3 digital twin. A digital twin that uses design insights, sensor data, asset physics, along with expert ‘human knowledge’ encoded into the digital twin, is a Level 4 digital twin representation. The most sophisticated digital twin in this taxonomy is Level 5 where the digital twin uses sensor data, physics-based insights and models, expert ‘human knowledge’ along with integration with enterprise systems such as Product Lifecycle Management (PLM), Enterprise Resource Planning (ERP), and Manufacturing Execution Systems (MES). We consider the Level 5 digital twin representation as the most sophisticated representation because it leverages information from multiple enterprise sources to provide a comprehensive view of all aspects of the asset.
Analyses
The data encoded in each flavor of the digital twin allows the engineer to perform various analyses corresponding to each digital twin representation. As described earlier, Level 1 and Level 2 (CAD/CAE/CAM) are already being used by engineering and design teams at major OEMs. In the Level 3 representation, the data model and sensor data are employed to perform regression, anomaly detection, and other data driven studies. In Level 3, the studies are primarily statistical in nature with seldom any input or insight provided from the design of the asset. The Level 4 representation provides the engineer with an ability to perform a variety of insightful analyses, primarily because this representation is augmented with physics-based models and with knowledge gained from an expert system. This knowledge could be provided by service engineers who have learned certain asset behaviors not necessarily encoded in statistical or physics-based models, and may consist of region-specific or context-specific insights. This expert system is extremely useful in failure mode analyses or decision trees to track down issues with assets. For instance, a pump service engineer might have noticed over time that tightening a few bolts or leveling the pump addresses overheating issues. This human knowledge can be very valuable to encode in a digital twin of the system that consists of the pump. Using this representation, one can perform system-level performance simulations, study what-if scenarios and perform system level optimization. Level 5 is the ideal target state of a complete digital twin. In addition to the Level 4 analyses, Level 5 digital twins can be used to understand the impact of asset behavior and performance on supply chain and procurement, i.e. product lifecycle, and manufacturing lifecycle, through integration with systems that focus on enterprise resource planning, manufacturing execution, Supervisory Control and Data Acquisition (SCADA), customer relationship management, and so on.
Visualization techniques
Data and insights obtained from each digital twin representation can be visualized in a variety of ways. Note that the essence of a visualization technique is to understand the computed data effectively and arrive at actionable insights. A basic model viewer can be employed to visualize the Level 1 representation. A variety of visualization techniques can be employed to glean insights from Level 2 through Level 5 digital twins, such as 1d, 2d or 3d plots, heat maps, scatter plots, animations, and histograms. With the gaining popularity of augmented, assisted, and virtual reality applications, these modalities of data visualization are becoming a compelling avenue to understand sensor data. A benefit of these methods is that the visualization is immersive and data can be superposed on the actual asset to help service engineers address any performance issues in an effective manner. This also minimizes errors and improves documentation of any corrective procedures that are done on assets.
Business outcomes tied to each representation
Associated with each representation are specific business outcomes that a manufacturer or asset operator can realize. Level 1 digital twin representations are used to design assets that can be (i) assembled (ii) manufactured and (iii) serviced. Level 2 digital twin representations can be employed to predict asset performance or failures during testing or in the field. The models developed in the design lifecycle of an asset are hugely beneficial in improving predictive capabilities of Level 4 and Level 5 digital twins. Since Level 3 digital representations receive sensor data and other performance parameters from the field, condition monitoring, real-time asset health and planned maintenance are potential outcomes. Tailor-made for brown-field equipment that has been in service for several years, this representation is ideal for assets where physics-based insights are not readily available. The predictive capability of such digital twins depends very much on the ability of the statistical models to capture the performance of the asset and trigger alerts when anomalies are detected. Interestingly, most digital twin offerings thus far tend to fall in this category.
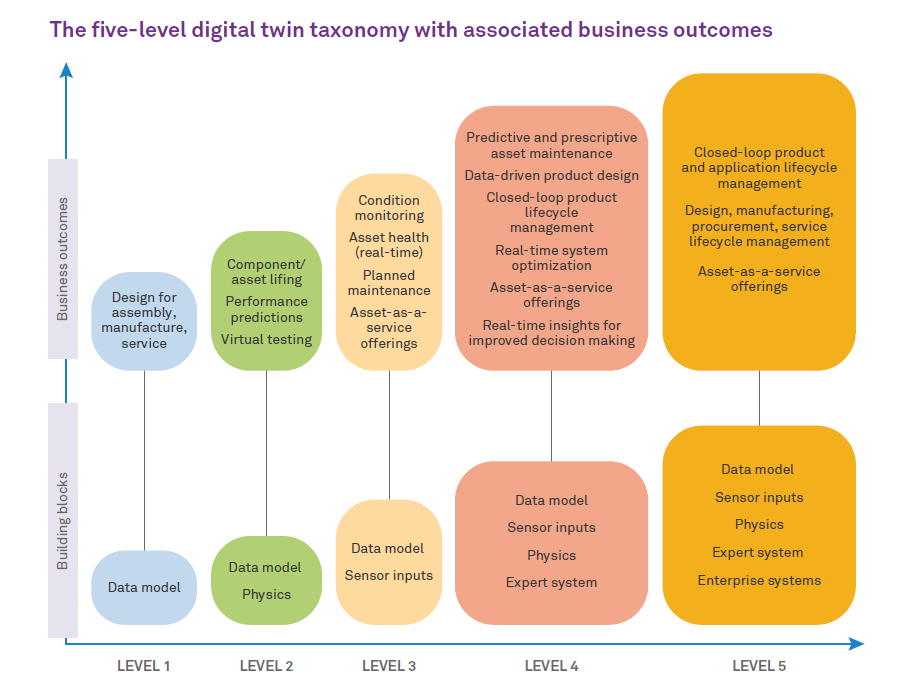
Level 4 and 5 are similar in terms of business outcomes, with the latter providing an improved ability over the former because of the availability of additional knowledge sources. Since information is available from both the design of the asset as well as from the field, the asset operator or manufacturer has the ability to:
Level 5 digital twins allow for outcomes enabled by closed-loop product life-cycle management, along with service and manufacturing life-cycle management. This ‘holy grail’ of digital twin representations allows for obtaining a holistic view of the asset from multiple perspectives that is not available in the other representations.
Looking ahead
Although digital twins have been discoursed for some time now, it has definitely been popularized by the advent of IoT. The five-level taxonomy presented here provides a foundation to meaningfully describe the building blocks, features, and outcomes of each representation. The maturity of a digital twin deployment can be assessed using the classification table presented here, which is important because it provides an asset manufacturer with a reason and motivation to continuously improve the capability of the digital twin that it has created for its assets. Further, we believe that this digital twin taxonomy can help to alleviate the confusion around this term in the industry today, and enable both technology vendors and adopters to form a common understanding of the concept through a shared perspective on the hierarchy of digital twin levels available today.
Reference
1 Gartner Research, Top 10 Strategic Technology Trends: Digital Twins, G00377678: 2019 [https://www.gartner.com/en/documents/3904569/top-10-strategic-technology-trends-for-2019-digital-twin]; G00346815: 2018 [https://www.gartner.com/en/documents/3867164/top-10-strategic-technology-trends-for-2018-digital-twin0]; G00319577: 2017 [https://www.gartner.com/en/documents/3647717/top-10-strategic-technology-trends-for-2017-digital-twin];
2 Dr. Michael Grieves, Digital Twin: Manufacturing Excellence through Virtual Factory Replication [https://research.fit.edu/media/site-specific/researchfitedu/camid/documents/1411.0_Digital_Twin_White_Paper_Dr_ Grieves.pdf], 2014
3 John Swanson and ANSYS - An Engineering Success Story, Proceedings of the 2014 Winter Simulation Conference [https://informs-sim.org/wsc14papers/includes/files/002.pdf"]
Dr. Madhusudan Pai
Director, Global Partner Engineering & Emerging Technology, Industrial and Engineering Services, Wipro Ltd.
Dr. Pai leads IoT ecosystem and emerging technology initiatives for Wipro. He is passionate about driving new collaborations and partnerships that leverage emerging trends in technology such as ubiquitous connectivity, blockchain, IoT, and autonomous systems. He works closely with a vibrant partner ecosystem to co-innovate, build end-to-end joint solutions, and define go-to-market strategy. In his past roles, Dr. Pai gained extensive experience in product strategy, product design, engineering consulting and delivery. His domain expertise spans aviation, energy & natural resources, aerospace, and heavy manufacturing industries.
Dr. Dattatraya Parle
Senior Practice Partner, IOT - Industrial and Engineering Services, Wipro Ltd.
Dr. Parle has 20 years of experience in different industries. His core engineering experience is around CAD/CAM, CAE, SLM & PLM whereas his emerging technologies experience is around Industry 4.0, 3D Printing, Virtual Reality and Augmented Reality. He has published 40+ papers and delivered several technical talks across national and international forums. He is on board and committee member of several industrial and academic bodies. Dr. Parle has worked across the product lifecycle for industries like aerospace, automotive, oil & gas, biomedical and nuclear engineering.
Calvin Smith, M.B.A
Director & Global Head, Partner Engineering (IoT, I4.0, Engineering Services), Wipro Ltd.
In his role at Wipro, Calvin and his team combine Wipro IP and services with Partner products and offerings to create differentiated end-to-end solutions designed to maximize customer ROI for specific use cases. Calvin also looks after the external ecosystem for Wipro IoT, covering analyst relations and academic research and engagement. Prior to this role, Calvin spent the better part of the last decade running IoT Strategy and Organic Innovation at Dell EMC. Calvin has lived in eight states in the US, as well as in Scotland and Spain; and has travelled to over 50 countries.