In our third article, we cover the SAVE Framework’s V principle: Visibility. By leveraging technology to create better organization visibility, manufacturers can improve processes, lower costs, and protect their bottom line.
For true visibility you need digital analytics. Now more than ever, digital analytics matter for manufacturers because they can drive business more efficiently. Manufacturing analytics technologies include Conversational Artificial Intelligence (AI) and Natural Language Processing (NLP) to Intelligence at Edge, bringing IoT Data Processing at Edge and Cloud.
For a manufacturing organization, improving visibility across business functions is crucial:
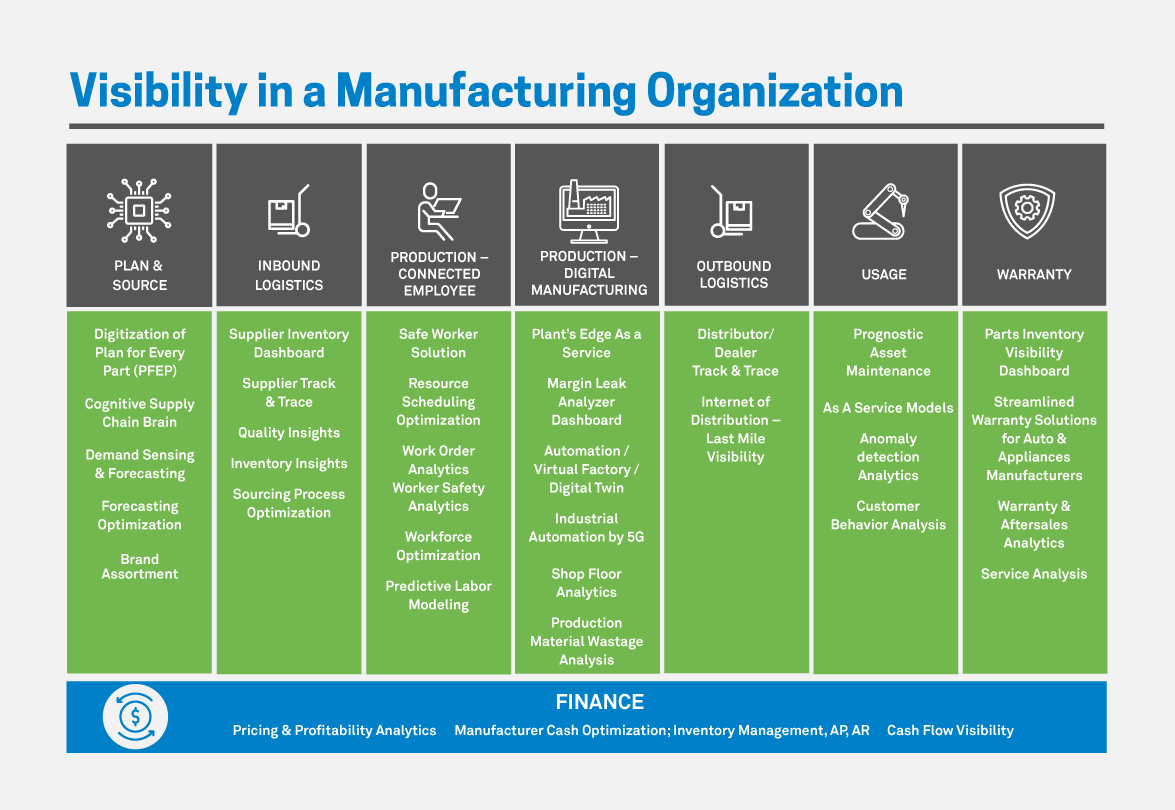
Visibility challenges are often driven by a lack of clarity for the final goal of a project as well as difficulty in moving beyond a project’s Proof of Concept stage. Today, manufacturers face these challenges:
To increase ROI for visibility projects and programs, Wipro recommends an Intelligence Enterprise solution powered by a persona-based approach that leverages analytics for manufacturers.
End users rely on a complex technology ecosystem (apps, environments, devices) to accomplish their daily work. This persona-based service approach ensures that those end users are categorized into personas and provided with a predefined set of services.
This persona-based service alignment ensures that personas are carefully defined and classified by roles, job functions, priorities, region, department, and day-to-day tasks as well as by understanding the systems of records a user requires to accomplish a job. Ultimately, this persona-based delivery system creates an employee experience that’s both contextual and personalized.
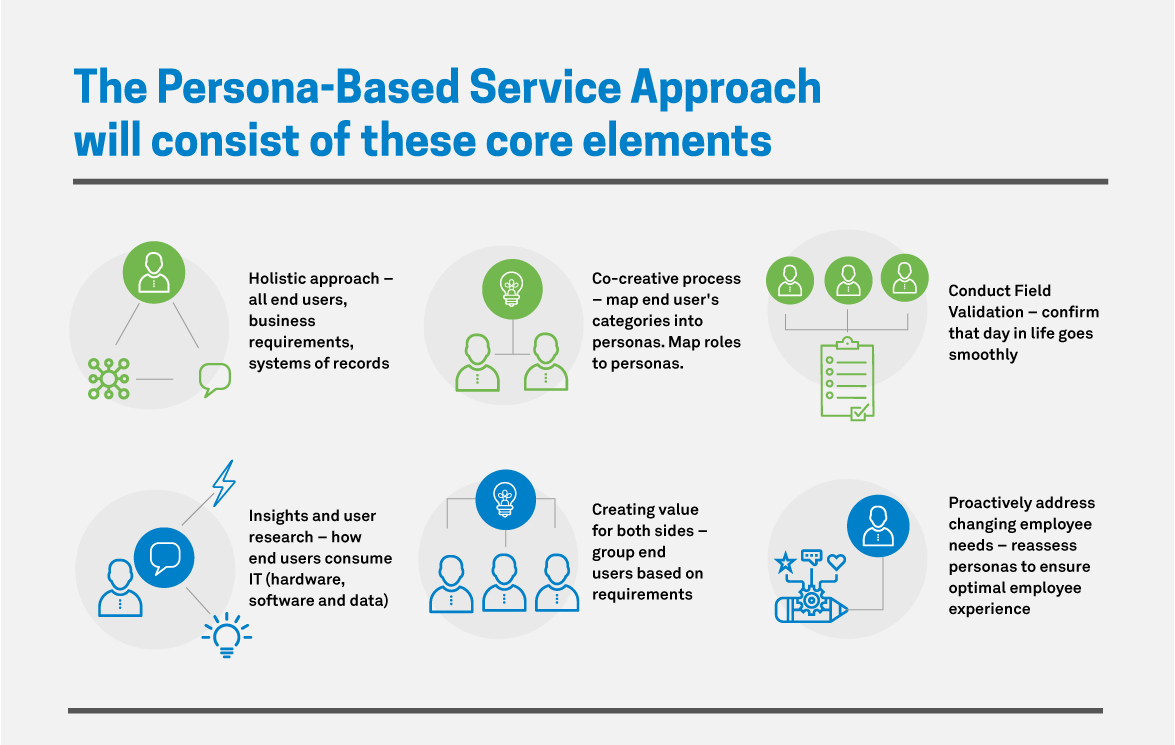
A manufacturer’s intelligence enterprise should focus on four personas by providing customized dashboards for each:
Plant Manager
Plant Managers generally work in a plant, overseeing day-to-day production, including using inputs, clearing bottlenecks, maintaining standards, and ensuring smooth, timely production. This function’s critical KPIs include On-Time Delivery to Commit, Manufacturing Cycle Time, and Minimizing Downtime.
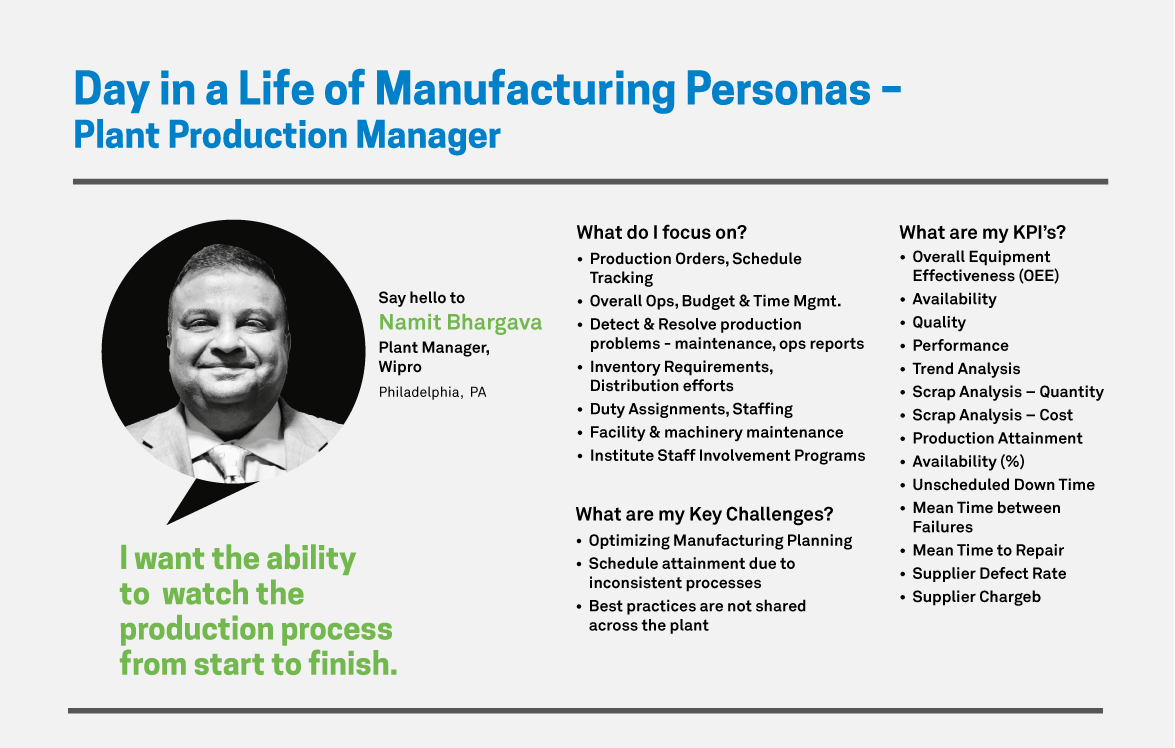
Plant Manager Dashboard
This dashboard is built using digital solutions that understand the expectations of a Plant Manager. It focuses on understanding Equipment Effectiveness and tracking Overall Equipment Effectiveness (OEE) trends, ensuring improved effectiveness over time. These measures ensure improved productivity that drives cost efficiency and improves margins.
Similarly, minimizing downtime by monitoring MTBF (Mean Time Between Failures) and MTTR (Mean Time to Repair) helps improve productivity, and by analyzing monthly trends, a plant manager can find areas that need improvement and act accordingly. The final metrics on scraps help assess plant waste and reduce Cost of Production by proactive minimizing scrap production.
Quality Manager
Quality Managers ensure plant products meet quality standards before they’re shipped. Primary responsibilities for this role include understanding customer expectations and needs, outlining quality standards, and developing quality control processes. This function’s critical KPIs include Count of Customer Complaints, Cost Impact of Customer Complaints, and Category-Wise Customer Complaint information.
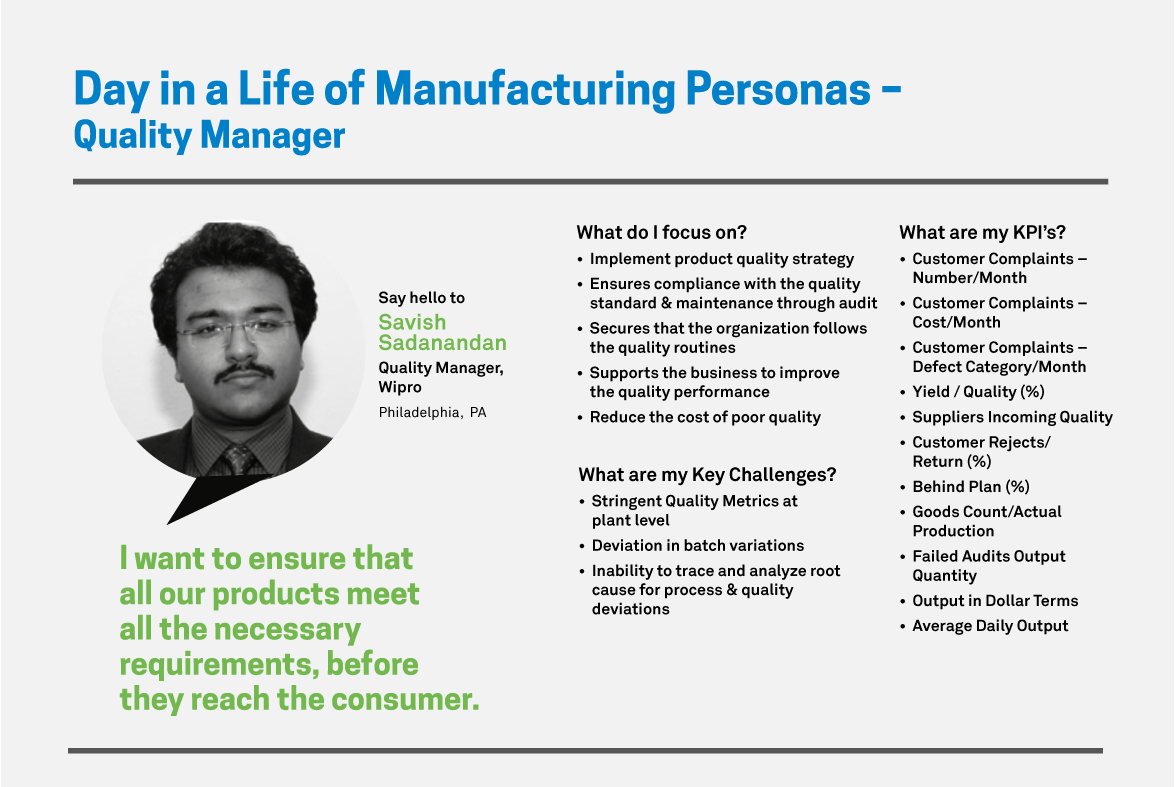
Quality Manager Dashboard
This dashboard implements digital solutions that focus on the Operation and Product Quality parameters with data points covering various factors that impact them, including Defect Density, Rate of Product Return, and current equipment downtime. Data from sources like the Returned Products Tracker help identify production quality issues and improve plant productivity as well as output quality.
Similarly, downtime details assess the impact and cost of each downtime event, helping quantify it in totality. Finally, the Production Cost Breakdown chart identifies the per-unit cost split and highlights target areas to optimize quality while maintaining costs.
Operations Manager
Operations Managers direct and supervise the day-to-day production operations of a manufacturing plant. Primary responsibilities include overseeing the day-to-day activities of production personnel to ensure efficient and safe work operations. Operation Managers also develop and implement action plans for achieving production targets. This function’s critical KPIs include Defect Density of Products, Production Cost Type Breakdown, Downtime Monitoring, and Production Tracking.
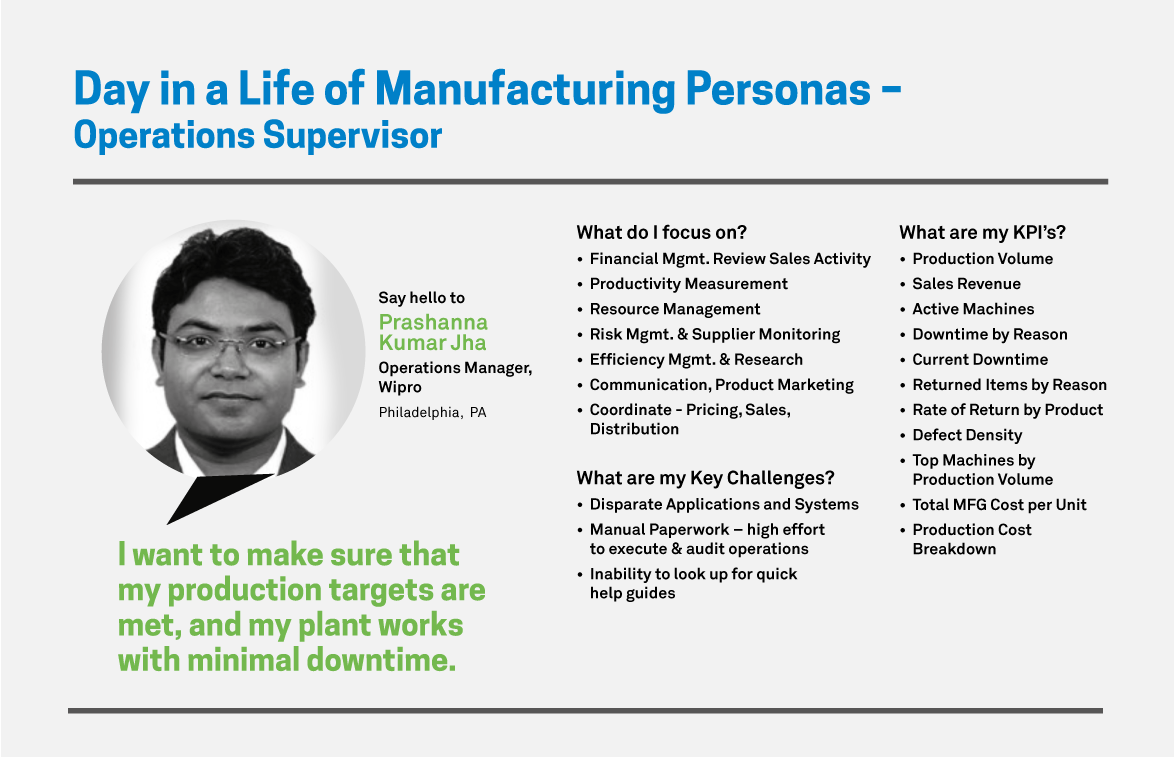
Operations Manager Dashboard
This dashboard uses digital solutions that provide insights on the Operational Parameters of a plant. These include output by weight and value and maintenance effectiveness as well as MTBF (Mean Time Between Failures), MTTR (Mean Time to Repair), customer complaint counts, cost, and Category. Monitoring Monthly Plant Production ensures proper tracking of the goods produced and manages output by meeting demand and quality schedules. Tracking maintenance parameters helps identify the impact that downtime has on production as well as compare downtime and upgrade costs. Finally, monitoring customer complaints helps identify defect-causing equipment and ways to improve production, ultimately driving revenue.
Procurement Manager
Procurement Managers oversee plant and manufacturer sourcing capabilities and supply chain. Primary responsibilities include strategizing and negotiating with suppliers and vendors to acquire cost-effective deals and minimize procurement expenses. This function’s critical KPIs include Top Categories by Spend, Top Cost Suppliers by Category, and Average Cost per Order.
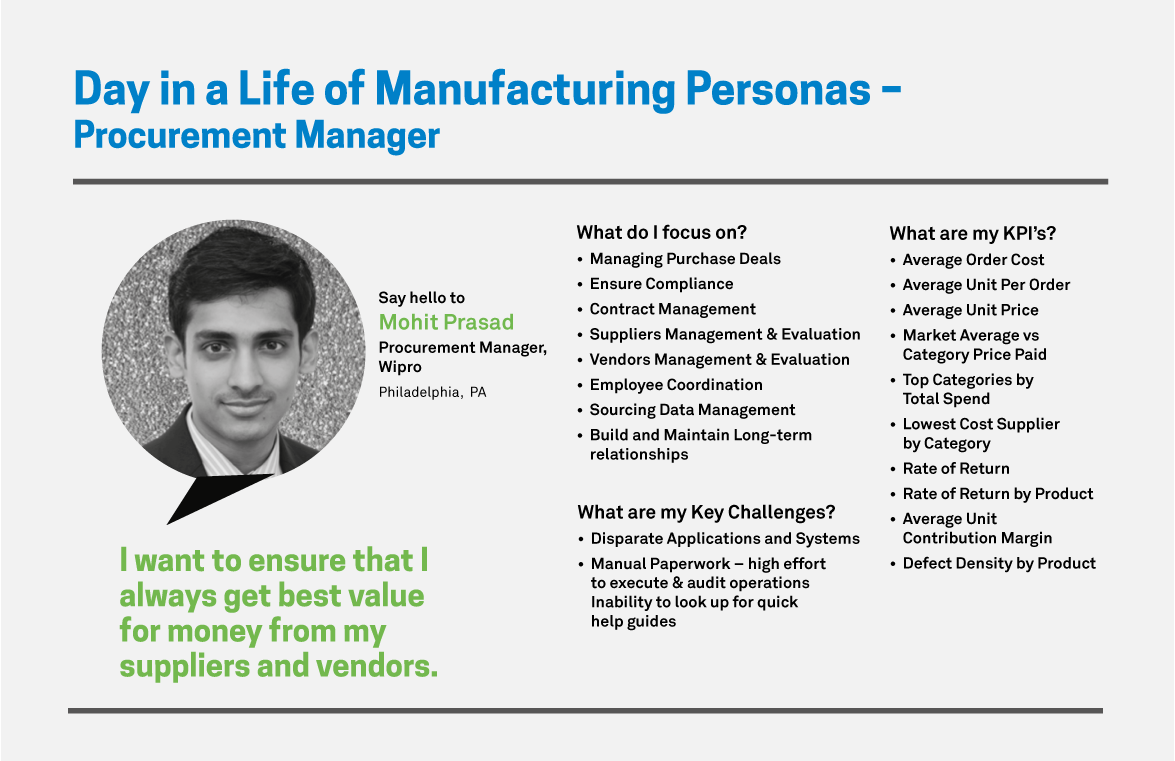
Procurement Manager Dashboard
This dashboard focuses on digital solutions that benchmark the cost of goods produced for the manufacturer. It showcases category-wide price spend to the market average and category-wide supplier cost. Rate of return details are also displayed, and viewable categories of spend help identify the high-cost areas and work on measures to reduce it further.
This dashboard also enables monitoring seasonal impacts on various spend categories. Overall cost figures -- like Average Order Cost, Average Unit per Order, and Avg. Unit Price -- help monitor the Cost of Production and track the effectiveness of cost reduction measures. Finally, the defect density graph highlights the categories of defects and provides a guideline for fixing them.
The SAVE Framework Approach:
These dashboards were designed to provide visibility -- simplifying and optimizing day-to-day activities, driving greater productivity, and reducing downtime. Prevailing current situations have emphasized the need for visibility, and analytics for manufacturers can accomplish that. Most manufacturers have oceans of data but lack information.
Wipro strategically partners with clients, helping them improve visibility and extend these insights to their suppliers and buyers by leveraging digital analytics for manufacturers. By deploying an Intelligence Enterprise solution with a persona-based approach, your organization can see these results:
If you’re interested in learning more about the SAVE Framework and how you can optimize your manufacturing enterprise, check out the other three articles highlighting this special optimization approach. Or, if you have questions or would like to set up your obligation-free assessment, contact us today to begin.
Namit Bhargava
GM & Head of Digital Sales, Digital Transformation
Passionate for results, Namit Bhargava brings innovative strategic perspective on Digital Transformation and Industry X.O themes for superior Customer Experience. Namit is a thought leader for CXO conversations for topics including digital strategy, transformation, new business models, and innovation.
Connect with Namit on LinkedIn
Savish Sadanandan
Senior Consultant, Digital Solutions
Savish Sadanandan is Senior Consultant focusing on bringing Digital Solutions across the Manufacturing Value Chain. Savish likes to analyze and understand the Client's pain points to identify linchpins which can drive Digital Transformation.
Connect with Savish on LinkedIn