A scientific approach to evaluation of RPA capability
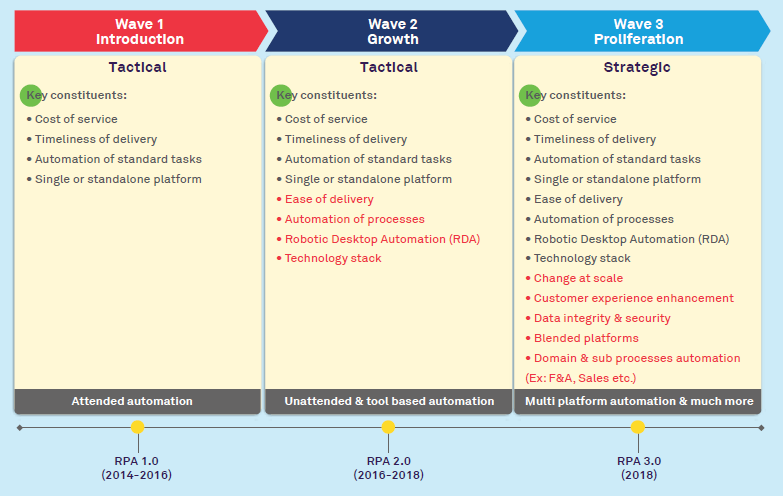
We are now entering RPA 3.0 or the 3rd wave of automation, where Artificial Intelligence (AI), Machine Learning (ML), scale-based automation and customer experience (CX) are spoken about together/interchangeably. The 1st wave of automation (RPA 1.0) was more of a rule-based process automation; and RPA 2.0 or the 2nd wave of automation was about task and complexity automation. The concept of RPA 3.0 becomes all the more important if we look at the rate at which the RPA market is expanding today, i.e. a $1.1 billion market in 2017 is expected to reach $8.6 billion by 2023, growing at a CAGR of 36.2% during 2018-2023 .
The RPA market has witnessed a state of crescendo in the last 2-3 years with multiple leading technology vendors and IT/BPM providers. For Business Process Management (BPM) or IT service providers, a multitude of factors are crucial today while they deal with clients. They are required to deliver more than their SLAs and need to look beyond the traditional Customer Value Model (CVM), Customer Satisfaction (CSAT) or Net Promoter (NPS) scores for thriving amidst guarded competition.
Figure 1 is indicative of how client expectations from the IT/BPM vendors have changed with times. It is important that an organization ensures that it receives apt support and services for effective RPA implementation.
We propose a balanced 10-factor weighted linear equation for a holistic vendor evaluation approach in this rapidly changing RPA world.
Existing vendor valuation models
While topline (revenue) and bottom-line (margins) are being accounted by businesses, only a few of them today are able to quantify the value delivered scientifically, especially across shared services, and then map it to the overall strategic and operational blueprints for their businesses. Existing models try to study this in detail, for e.g. the CLV or VLV (cus-tomer/vendor lifetime value) and Net Present Value (NPV). These calculation processes use forecasts of revenues, estimated cost of delivering value, potential of future value etc. or vendor profitability that takes into account the profit a client makes over a sustained period of time, say 5 or 10 years. While all of these are vital and still valid, clients today are expected to go beyond these attempted models in the future.
Model for holistic vendor valuation
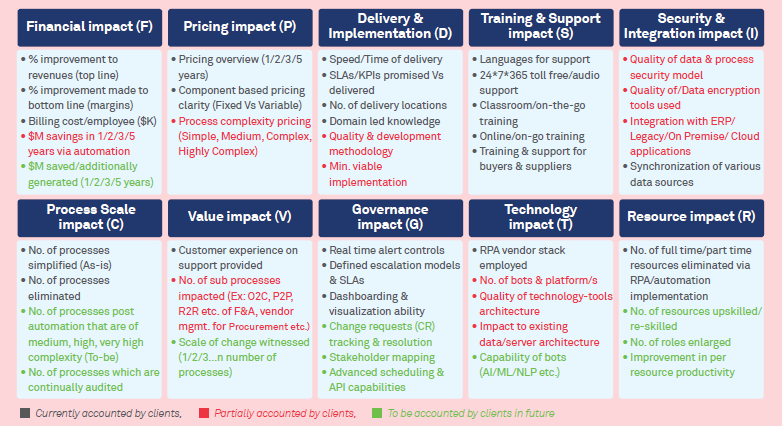
The model envisages itself from a client perspective and takes into consideration ten factors that are measurable and can yield to an all-inclusive model of valuation (See Figure 2).

Figure 1: Changing expectations of businesses from RPA service providers

Figure 2: 10-factor approach to vendor evaluation RPA
In Figure 2, proposed components have been listed under ten categories, namely Financial Impact (F), Pricing impact (P), Delivery & Implementation (D), Training & support impact (S), Security & Integration (I), Process scalability (C), Value impact (V), Governance impact (G), Technology impact (T) & Resource impact (R). There are many areas (Given in Green) which will evolve over a period of next 1-2 years. Let us try and assign priorities to each of these factors, given the importance a client can hold for each while being serviced by a IT/BPM vendor. The weights being proposed below are only indicative* and can vary depending on the applicability for each client/a set of clients and these could further vary by the intensity of RPA deployments across industries, i.e. Manufacturing, Retail, CPG, Travel & Transportation, Healthcare etc.
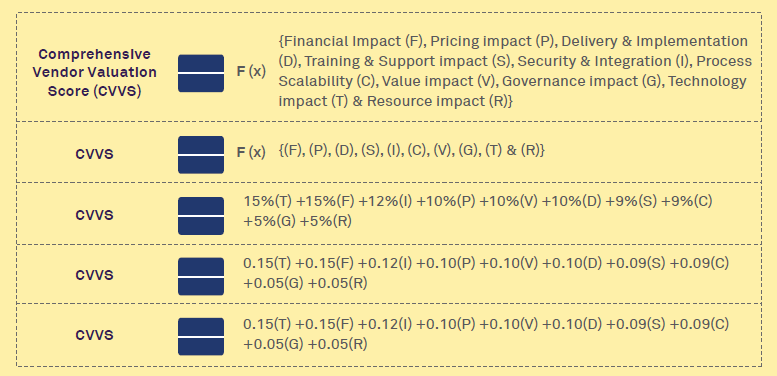
If this is plotted as a linear equation, the above weights could be depicted as 15%(T) +15%(F) +12%(I) +10%(P) +10%(V) +10%(D) +9%(S) +9%(C) +5%(G) +5%(R), or it can be depicted as 0.15(T) +0.15(F) +0.12(I) +0.10(P) +0.10(V)
+0.10(D) +0.09(S) +0.09(C) +0.05(G) +0.05(R).
Figure 3 represents a proposed numerical approach to calculate the Comprehensive Vendor Valuation Score (CVVS).
To start with, a value on a scale of 1-5 (1 being the lowest and 5 being the highest) can be calculated for each of the factors. E.g. Technolo-gy impact (T) can have a scale of 1-5 with a predefined set of matrices that help assign a score of 1-5. If Technology impact (T) has 4 parameters each with a score of 3 (the higher the vendor performance on a particular parameter, the higher the score), then the score of (T) is the average of four parameters, i.e. 3+3+3+3/4=3. Thus, (T) has a total score of 3.

Figure 3: Numerical approach to RPA vendor evaluation
The same process can be repeated for remainder of the parameters and a net equation can be formed. This net equation when multiplied by their weights of 15%, 12%, 10%, 9% & 5% will give a total CVVS on a scale of 1-5. Going by general industry standards a net score of >=3.5 would be considered a true reflector of the value being created for clients.
This approach for organizations to rate their vendors could serve as a pointer to examine industry, business, technology, and delivery factors apart from the conventional factor of pricing. A famous quote by Brian Tracy connotes this, “Value is the difference between the price you charge and the benefits the customer perceives they will get. If the customer perceives they will get a lot of benefit for the price they pay, then their perception of value is very high.”3
The higher the price-value sensibility on either sides of the table, the greater are the levels of satisfaction and brighter are prospects for business and relationships in this world of automation.
Endnote
1. https://www.psmarketresearch.com/market-analysis/robotic-process-automation-market
3. https://www.briantracy.com/blog/sales-success/how-to-sell-value-rather-than-price/
Mehul Damani - Digital Operations & Platforms, Enterprise Operations Transformation, Wipro
Mehul brings in 11 years of experience working with Fortune 100 companies across domains such as digital strategy and transformation, sales enablement operations, corporate marketing, pre-sales and B2B/B2C consulting.